Description
Video games investment funds Q1 2020. This release contains all the extensive information on hundreds of investment funds, venture companies and individual investors working with video games, AR / VR, game tech and gaming hardware industries. Here you will find the information regarding the investors who are interested or connected in any way with gaming industry which was checked for every single one of them. Some of these investors are working with game developers, some of them are interested in gaming tech and hardware, some are interested in VR and AR, and much more. This report contains the whole investment market analysis with all the venture funds reviewed one by one to provide you with the ones who are interested in gaming related projects. All the investors and funds can be found here with extensive commentaries and contact information. We collected both the smaller ones and the biggest ones as well so it's possible to find the investor for any sized project with this research. Report also comes with all the spreadsheets with original information collected to check and use in any way you want. Check the table of contents to better understand the content of this release.
- Contents
- About the Research
- — Goals
- — Research Relevance and Periods
- — Glossary
- — Labour Costs
- — Methodology
- Public Gaming Industry Investments
- — Public Investments Q1 2019
- — Public Investments Q1 2020
- Video Games Investment Funds
- — Raw Date Guide
- — Video Games Investment Funds Catalog
- — Consolidated Funds Data
- — Government Support and Government Supported Funds
- —- Government Investment Incentive
- —- Investment Incentives Examples in Some Countries
- —- Highly Involved Funds Comparison by State Support Reported
- — Gaming Market Segments and Funds That Invest in Them
- —- Mobile Games Investment Funds
- —- AR/VR Technologies Investment Funds
- —- E-sport Investment Funds
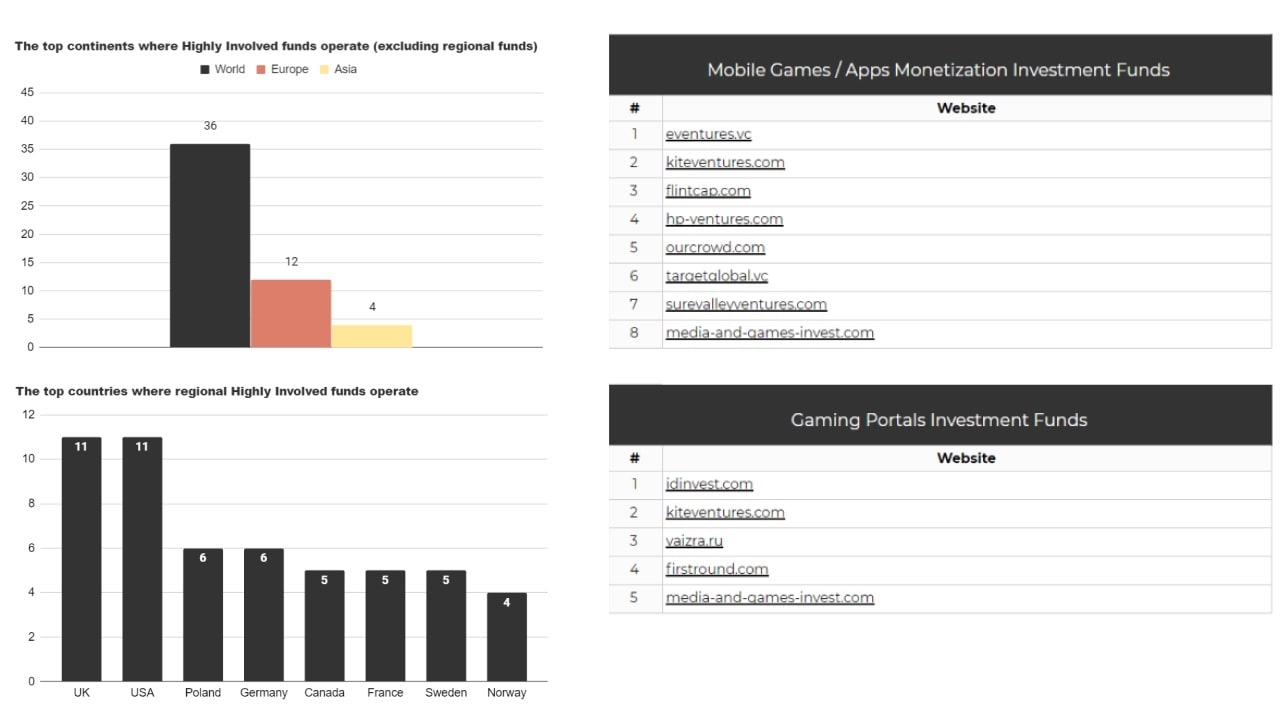
- —- Mobile Games / Apps Monetization Investment Funds
- —- Gaming Portals Investment Funds
- — Investments in Gaming Funds: Where the Money Comes From
- —- Game Investment Funds Types
- —- Data40 Hypotheses
- —— Abstracts on Gaming Funds Investments
- —— Summary and Guidance on How to Attract Investors
- — How Gaming Funds Source and Choose Projects
- —- Sourcing gaming projects for possible investment
- —- Gaming Industry Events 2020 Catalog
- —- Networking and Connecting Tools During Pandemia
- —- Selecting Projects for Gaming Investments
- Conclusion
- — Investment Funds Attractiveness Factors
- — Addendum
- About the Authors
Goals
- Find the total gaming industry investments amount in Q1 2020;
- Compile a gaming industry investment funds catalog;
- Compare the funds listed and identify the leaders;
- Overview and define the characteristics of the target market;
- Determine how funds raise finances;
- Determine how funds choose projects to invest;
- Provide an overview of incentives, benefits, and government programs in the target industry.
Research Relevance and the Periods
- Raw data was gathered in between 01/01/2020 and 02/12/2020;
- Processing and analysis of the information collected was executed in between 02/01/2020 and 04/30/2020;
- An additional raw data was gathered in between 03/05/2020 and 03/31/2020.
Glossary
The terminology presented here is not generally accepted and used specifically for this.
- Highly Involved: The funds that invested to 3 or more Game/Game Tech projects, such as:
- Game studios;
- Development of one game or a series;
- Gaming technologies and services.
- Partially Involved: The funds that invested to 1-2 Game/Game Tech projects;
- Non-core: The funds with at least 1 investment to the area related to gaming, such as:
- E-sports platforms and services;
- Game monetization and analytics platforms;
- Gaming portals;
- Projects with game mechanics;
- Other websites and services related to gaming.
- IT/Tech: Internet and hi-tech companies;
- Game/GameTech: gaming focused services and gaming technology projects, websites, platforms, solutions and technologies.
Labour Costs
- Raw data gathering: 524 hours spent;
- Data structuring: 119 hours spent;
- Analysis and conclusions: 103 hours spent.
Full Version Also Contains
- XLSX raw data table with 345 IT/tech investment funds with game development investment tools marked separately;
- 24 consolidated charts and graphs with analysis and additional information:
- 2 tables with Public investment transactions in the gaming industry Q1 2019 and Q2 2020;
- 1 table with Highly Involved Funds from 3 investments for gaming (125 strings);
- 1 table with Partially involved funds from 1-2 investments for gaming (84 strings);
- 1 table with Highly Involved fonds declared their total capitals (31 strings);
- 1 table with Highly Involved funds over 20 (19 strings);
- 1 table with Highly Involved funds over 10 but under 20 (26 strings);
- 1 table with number of inactive Deep funds (7 strings);
- 3 tables with Government Support funds (Highly Involved – 44 strings, Partially involved – 6 strings, Non-core – 4 strings);
- 1 table with comparison of Highly Involved Funds by State Support Reported;
- 5 tables with Gaming Market Segments and funds that invest in them: Mobile Game developers (67 strings), AR/VR (49 strings), E-Sport (20 strings), Game monetisation (8 strings), Gaming portals (5 strings);
- 3 table with types of Investment in gaming funds: Private investments (10 strings), Group investments (2 strings), Crowdfunding (1 string);
- 3 table with sourcing projects for investment in gaming: Cold search (9 strings), Indie portals (4 strings), Highly Involved Accelerators for cooperation (18 strings).
- Extended additional texts;
- Table with Networking and Connecting tools during Pandemia;
- Gaming Industry Events 2020 Catalog;
- 23 consolidated tables with additional data based on Raw Data table.
- Video Games investment funds Q1 2020.pdf
- Video Games Investment Funds Catalog Q1 2020.xlsx
- Gaming Industry Events 2020 Catalog.xlsx
- Public gaming industry related investment transactions 2019-2020.xlsx

