

Description
Goals and Objectives of the Research
Research Objective: To perform a comparative analysis of the Q4FY23 quarterly report and those of previous periods.
Research Tasks:
- Gather comprehensive financial and corporate information pertaining to the company for Q4FY23;
- Analyze the collected information;
- Conduct a comparative assessment of the Q4FY23 report with the reports from previous quarters of the current fiscal year and Q4FY22;
- Formulate conclusions based on the analyzed data.
Disclaimers
The information collected in this report reflects data from the company's public reports and is not questioned or verified via other sources. In other words, information from the company's public reports is taken and used as is.
If additional information from other sources is used or if the data used is reflective of the researcher's personal opinion, this will be labeled accordingly.
The provided public company reports are unaudited.
Document Markup
- FY - Financial Year;
- Q - Quarter;
- Boyd - Boyd Gaming Corporation;
- QoQ - Quarter-over-Quarter;
- This report uses the American number format: a period is used as the decimal separator, while commas separate thousands;
- Year-over-year (YoY) calculations of relative values were not performed in cases where last year's profit changed to a loss in the current year and vice versa within the scope of the current report;
- Boyd Gaming Corporation Annual Report Period is from January 1 to December 31, 2023;
- The specified financial year coincides with the calendar year.
Conclusions
General Information
| Parameter | Boyd Gaming Corporation |
| Website | boydgaming.com |
| Country (location) | USA |
| Country (issuer) | USA* |
| Year of foundation | 1975 |
| Chairman | William S. Boyd |
| Sector | Consumer Services |
| Type | Public |
| Year of IPO | 1993 |
| Stock market | NYSE |
| Ticker | BYD |
| Previous Annual Report from Data40 | - |
| Previous Quarterly Report from Data40 | Boyd Gaming Corporation Q3FY23 Report Overview |
*Note: To access the registry, enter the company name in the "Name" field and click "Search." In the "Business entity and mark search result" window, select the company.
About Company
Founded in 1975, Boyd Gaming Corporation (NYSE: BYD) operates 28 gaming entertainment properties in 10 states. It also manages a tribal casino in northern California, and owns and operates Boyd Interactive, a B2B and B2C online casino gaming business. The Company is a strategic partner and holds a 5% equity stake in FanDuel Group, the nation's sports-betting operator.
Conference Call Information
Boyd Gaming hosted a conference call to discuss its Q4FY23 and FY23 results on February 8, at 5:00 p.m. ET. The conference call number: (888) 259-6580, passcode 04276776. A replay is available by dialing (877) 674-7070 starting from Tuesday, February 8, and continuing through Tuesday, February 15. The conference number for the replay: 276776#. The replay is accessible via Investor Relations.
Public Quarterly Reports Calendar FY23-24
| Quarter | Period | Date |
| FY23 | ||
| Q1 | Jan 1, 2023 to Mar 31, 2023 | April 4, 2023 |
| Q2 | Apr 1, 2023 to Jun 30, 2023 | July 27, 2023 |
| Q3 | Jul 1, 2023 to Sep 30, 2023 | October 24, 2023 |
| Q4 and FY23 | Oct 1, 2023 to Dec 31, 2023 | February 8, 2024 |
| FY24 | ||
| Q1 | Jan 1, 2024 to Mar 31, 2024 | April 22, 2024 (Projected) |
| Q2 | Apr 1, 2024 to Jun 30, 2024 | July 22, 2024 (Projected) |
| Q3 | Jul 1, 2024 to Sep 30, 2024 | October 21, 2024 (Projected) |
| Q4 and FY24 | Oct 1, 2024 to Dec 31, 2024 | February 19, 2025 (Projected) |
Follow the announcements of the release of new reports on the website Data40.com in the Calendars by Financial reports section of DATA40.com.
Highlights and Metrics
Q4FY23 Highlights
- For Q4FY23, revenues reached 954.412 million USD, increasing from 922.921 million USD in Q4FY22;
- The Company reported a net income of 92.605 million USD, or 0.94 USD per share, for Q4FY23, compared to 172.684 million USD, or 1.63 USD per share, for Q4FY22;
- The Company’s Q4FY23 results were impacted by 103.300 million USD in non-cash, pretax goodwill and intangible asset impairment charges;
- Total Adjusted EBITDAR was 355.462 million USD in Q4FY23, versus 360.102 million USD in Q4FY22;
- Adjusted Earnings for Q4FY23 were 163.825 million USD, or 1.66 USD per share, compared to 181.757 million USD, or 1.72 USD per share, for Q4FY22;
- During Q4FY23, 100 million USD in shares of its common stock were repurchased. As of December 31, 2023, the Company had 326 million USD remaining under current share repurchase authorizations.
Acquisitions and Divestitures
The company did not make any acquisitions during the Q4FY23.
Business Outlook
In the report The Company does not make forward-looking statements regarding Business Outlook.
Stock Information
About Shares
Total Shares Outstanding - 97,862,123 (as of October 30, 2023).
Weighted average basic shares outstanding (Basic) ≈ 101,325,000 (Year Ended December, 31).
Weighted average basic shares outstanding (Diluted) ≈ 101,373,000 (Year Ended December, 31).
The company does not provide information on Total Shares Outstanding as of December 31, 2023, in the Q4 and FY23 Current Report. This information will be announced subsequently following the release of the full FY23 financial report by Boyd Gaming Corporation.
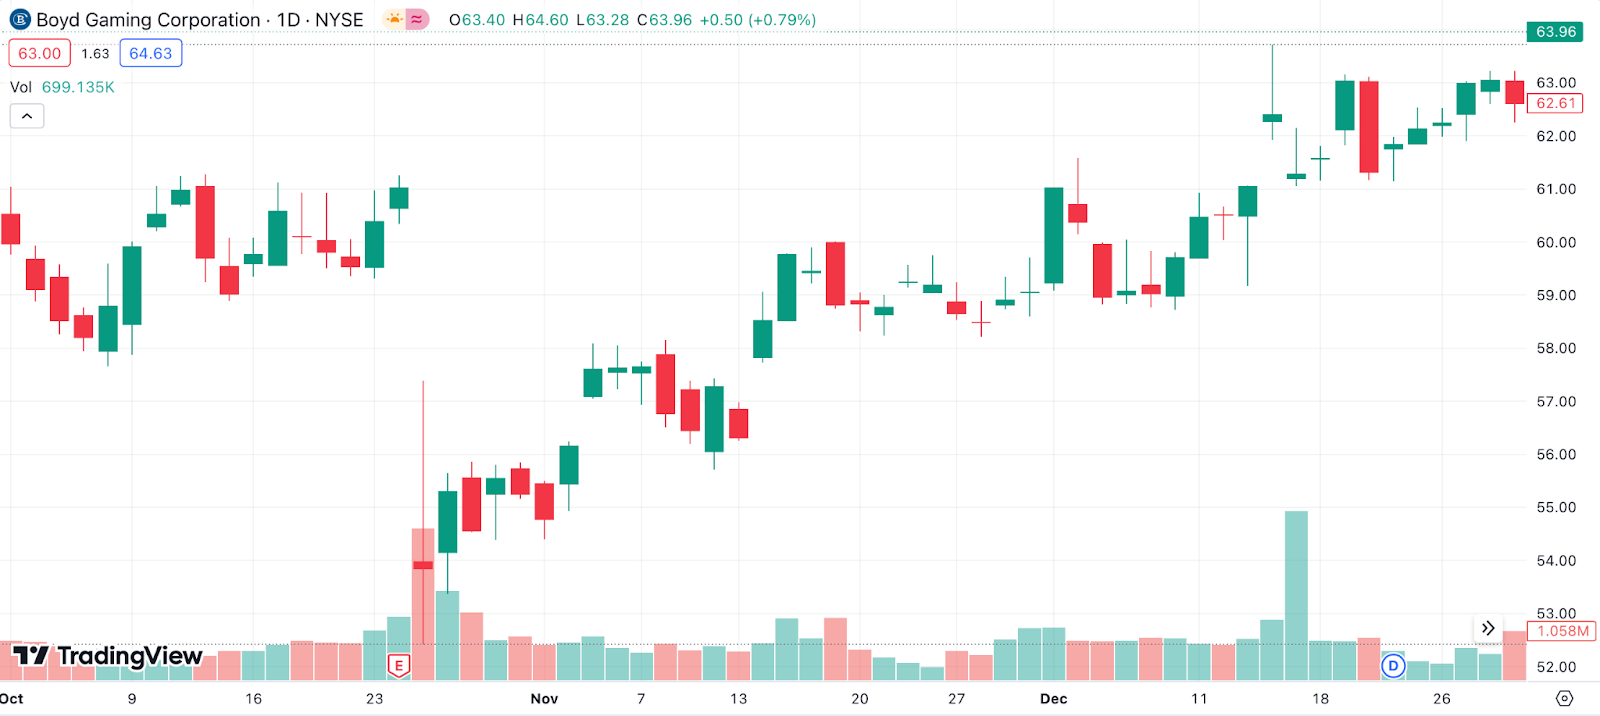
TradingView Retrospective Q4FY23
| Date | Open Price, USD | Highest Price, USD | Lowest Price, USD | Close Price, USD |
|---|---|---|---|---|
| Oct 2, 2023 | 60.53 | 61.04 | 59.76 | 59.97 |
| Dec 29, 2023 | 63.05 | 63.23 | 62.25 | 62.61 |
Q4FY23 Price MAX: 63.72 USD (December 14, 2023).
Q4FY23 Price MIN: 52.42 USD (October 25, 2023).
Financial Statements
Revenue Retrospective
Boyd Gaming Corporation Revenue Retrospective


Sales per Business
Net Revenue Structure
(In million, except Percentages)
| Parameter | Q4FY23, USD | QoQ, % | Q3FY23, USD | QoQ, % | Q2FY23, USD | QoQ, % | Q1FY23, USD | QoQ, % | Q4FY22, USD | YoY, % |
| Gaming | 647.083 | 0.92 | 641.168 | -2.96 | 660.729 | -0.54 | 664.308 | 1.60 | 653.876 | -1.04 |
| Food & beverage | 75.481 | 6.33 | 70.986 | 0.88 | 70.366 | -1.70 | 71.584 | -3.45 | 74.145 | 1.80 |
| Room | 50.571 | 3.80 | 48.720 | -2.09 | 49.761 | -0.61 | 50.065 | -0.04 | 50.086 | 0.97 |
| Online | 124.058 | 37.40 | 90.288 | 6.22 | 85.002 | -30.82 | 122.863 | 36.98 | 89.695 | 38.31 |
| Management fee | 22.292 | 29.96 | 17.153 | -1.68 | 17.446 | -12.90 | 20.030 | 19.61 | 16.746 | 33.12 |
| Other | 34.927 | 0.22 | 34.849 | 3.58 | 33.646 | -4.19 | 35.116 | -8.49 | 38.373 | -8.98 |
| Total Consolidated Revenue | 954.412 | 5.67 | 903.164 | -1.50 | 916.950 | -4.88 | 963.966 | 4.45 | 922.921 | 3.41 |
Net Revenue Structure Percentages
| Parameter | Q4FY23, % | Q3FY23, % | Q2FY23, % | Q1FY23, % | Q4FY22, % |
| Gaming | 67.80 | 70.99 | 72.06 | 68.91 | 70.85 |
| Food & beverage | 7.91 | 7.86 | 7.67 | 7.43 | 8.03 |
| Room | 5.30 | 5.39 | 5.43 | 5.19 | 5.43 |
| Online | 13.00 | 10.00 | 9.27 | 12.75 | 9.72 |
| Management fee | 2.34 | 1.90 | 1.90 | 2.08 | 1.81 |
| Other | 3.66 | 3.86 | 3.67 | 3.64 | 4.16 |
Sales by Segment
Sales by Segment
(In million, except Percentages)
| Parameter | Q4FY23, USD | QoQ, % | Q3FY23, USD | QoQ, % | Q2FY23, USD | QoQ, % | Q1FY23, USD | QoQ, % | Q4FY22, USD | YoY, % |
| Las Vegas Locals | 235.075 | 5.97 | 221.833 | -3.94 | 230.940 | -3.88 | 240.270 | -0.27 | 240.916 | -2.42 |
| Downtown Las Vegas | 63.314 | 27.79 | 49.545 | -6.50 | 52.991 | -6.31 | 56.557 | -9.42 | 62.442 | 1.40 |
| Midwest & South | 497.898 | -2.95 | 513.028 | -1.12 | 518.846 | 1.30 | 512.173 | 3.15 | 496.532 | 0.28 |
| Online | 124.058 | 37.40 | 90.288 | 6.22 | 85.002 | -30.82 | 122.863 | 36.98 | 89.695 | 38.31 |
| Managed & Other | 34.067 | 19.66 | 28.470 | -2.40 | 29.171 | -9.13 | 32.103 | -3.70 | 33.336 | 2.19 |
| Total Revenues | 954.412 | 5.67 | 903.164 | -1.50 | 916.950 | -4.88 | 963.966 | 4.45 | 922.921 | 3.41 |
Sales Volume by Platforms Percentages
| Parameter | Q4FY23, % | Q3FY23, % | Q2FY23, % | Q1FY23, % | Q4FY22, % |
| Las Vegas Locals | 24.63 | 24.56 | 25.19 | 24.93 | 26.10 |
| Downtown Las Vegas | 6.63 | 5.49 | 5.78 | 5.87 | 6.77 |
| Midwest & South | 52.17 | 56.80 | 56.58 | 53.13 | 53.80 |
| Online | 13.00 | 10.00 | 9.27 | 12.75 | 9.72 |
| Managed & Other | 3.57 | 3.15 | 3.18 | 3.33 | 3.61 |
Dividend Information
(In million, except Per share data and Percentages)
| Parameter | Q4FY23, USD | QoQ, % | Q3FY23, USD | QoQ, % | Q2FY23, USD | QoQ, % | Q1FY23, USD | QoQ, % | Q4FY22, USD | YoY, % |
| Per share | 0.16 USD | 0.00 | 0.16 USD | 0.00 | 0.16 USD | 0.00 | 0.16 USD | 6.67 | 0.15 USD | 6.67 |
| Cash dividends declared | - | - | 15.804 | -1.48 | 16.041 | -1.52 | 16.289 | 5.25 | 15.476 | - |
Balance Sheet
(In million, except Percentages)
| Parameter | Q4FY23, USD | QoQ, % | Q3FY23, USD | QoQ, % | Q2FY23, USD | QoQ, % | Q1FY23, USD | QoQ, % | Q4FY22, USD | YoY, % |
| Assets | ||||||||||
| Total Current Assets | - | - | 469.248 | 2.22 | 459.046 | 0.37 | 457.355 | -4.36 | 478.228 | - |
| Total Non-Current Assets | - | - | 5,842.363 | -0.05 | 5,845.435 | -0.37 | 5,867.232 | 0.59 | 5,832.899 | - |
| Total Assets | - | - | 6,311.611 | 0.11 | 6,304.481 | -0.32 | 6,324.587 | 0.21 | 6,311.127 | - |
| Liabilities | ||||||||||
| Total Current Liabilities | - | - | 583.419 | 6.74 | 546.566 | -7.70 | 592.172 | 1.03 | 586.134 | - |
| Total Non-Current Liabilities | - | - | 3,959.711 | -1.23 | 4,009.106 | -1.53 | 4,071.446 | -1.52 | 4,134.368 | - |
| Total Liabilities | - | - | 4,543.130 | -0.28 | 4,555.672 | -2.31 | 4,663.618 | -1.21 | 4,720.502 | - |
| Total Equity | - | - | 1,768.481 | 1.12 | 1,748.809 | 5.29 | 1,660.969 | 4.42 | 1,590.625 | - |
Note: The company does not provide information on the Balance Sheet in the Q4 and FY23 Current Report. This information will be announced subsequently following the release of the full FY23 financial report by Boyd Gaming Corporation.
Income Statement
(In million, except EPS data and Percentages)
| Parameter | Q4FY23, USD | QoQ, % | Q3FY23, USD | QoQ, % | Q2FY23, USD | QoQ, % | Q1FY23, USD | QoQ, % | Q4FY22, USD | YoY, % |
| Revenue | 954.412 | 5.67 | 903.164 | -1.50 | 916.950 | -4.88 | 963.966 | 4.45 | 922.921 | 3.41 |
| Total Operating Costs and Expenses | 799.361 | 16.65 | 685.292 | 1.84 | 672.921 | -0.91 | 679.087 | 0.56 | 675.284 | 18.37 |
| Operating Income | 155.051 | -28.83 | 217.872 | -10.72 | 244.029 | -14.34 | 284.879 | 15.04 | 247.637 | -37.39 |
| Net Income | 92.605 | -31.52 | 135.233 | -29.73 | 192.454 | -3.64 | 199.731 | 15.66 | 172.684 | -46.37 |
| EPS Basic | 0.94 USD | -29.85 | 1.34 USD | -29.10 | 1.89 USD | -2.07 | 1.93 USD | 17.68 | 1.64 USD | -42.68 |
| EPS Diluted | 0.94 USD | -29.85 | 1.34 USD | -29.10 | 1.89 USD | -2.07 | 1.93 USD | 18.40 | 1.63 USD | -42.33 |
Cashflow Statement
(In million, except Percentages)
| Parameter | Q4FY23, USD | QoQ, % | Q3FY23, USD | QoQ, % | Q2FY23, USD | QoQ, % | Q1FY23, USD | QoQ, % | Q4FY22, USD | YoY, % |
| Cash flows from operating activities | - | - | 233.977 | 29.20 | 181.100 | -35.82 | 282.175 | 13.74 | 248.077 | - |
| Cash flows from investing activities | - | - | (75.665) | 71.99 | (43.994) | -44.96 | (79.927) | -70.52 | (271.160) | - |
| Cash flows from financing activities | - | - | (159.148) | 11.36 | (142.917) | -34.75 | (219.037) | - | 48.629 | - |
Note: The company does not provide information on the Cash Flow Statement in the Q4 and FY23 Current Report. This information will be announced subsequently following the release of the full FY23 financial report by Boyd Gaming Corporation.
News
October 6, 2023 - Boyd Gaming to Report Third-Quarter 2023 Results, Host Conference Call and Webcast on October 24.
October 24, 2023 - Boyd Gaming Reports Third-Quarter 2023 Results.
December 7, 2023 - Boyd Gaming Announces Quarterly Dividend.
December 14, 2023 - Boyd Gaming Announces Senior Executive Appointments.
Analyst's Opinion
Summary
Boyd Gaming Corporation operates 28 gaming entertainment properties in 10 states, manages a tribal casino in northern California, and owns and operates Boyd Interactive. Since 1993, it has been trading on the NYSE under the ticker BYD.
As of October 30, 2023, Total Shares Outstanding were 97,862,123. During Q4FY23, the company's shares traded in the range of 52.42 USD to 63.72 USD, with an opening price on October 2, 2023, at 60.53 USD and a closing price on December 29, 2023, at 62.61 USD.
Revenue Retrospective demonstrates positive growth over three fiscal years: 3,369.810 million USD for FY21; 3,555.377 million USD for FY22; and 3,738.492 million USD for FY23. Total Revenue increased by 3.41% in Q4FY23, reaching 954.412 million USD compared to Q4FY22, where revenue was 922.921 million USD. The Gaming Segment's share of revenue in Q4FY23 was 67.80%, amounting to 647.083 million USD of the quarterly Total Revenue.
Net income in Q4FY23 reached 92.605 million USD, marking a 46.37% decrease compared to Q4FY22, where net income was 172.684 million USD, and a 31.52% decrease compared to Q3FY23, where net income was 135.233 million USD.
The company repurchased 100 million USD of its common stock in Q4FY23, leaving 326 million USD remaining under its share repurchase plan.
In Q4FY23, the company paid dividends of 0.16 USD per share.
Boyd Gaming Corporation released its financial results for Q4FY23 on February 8, 2024. Follow the announcements of the release of new reports on the website Data40.com in the Calendars by section DATA40.com.
Sources List
- Boyd Gaming Corporation website
- Simplywall
- NYSE
- Nevada Secretary of State
- Stock Analysis
- Market Screener
- Tradingview
- NASDAQ
- Boyd Consolidated Q4 and FY23 Current Report
- Boyd Consolidated Q3FY23 Report
- Boyd Consolidated Q2FY23 Report
- Boyd Consolidated Q1FY23 Report
- Boyd Consolidated Annual Report 2022
- Data40
META

Data40 - professional research agency. We do all kinds of researches in gaming, gamedev, gambling, venture and blockchain. 15+ years of experience in the field. Loyal price development, quick and informative results.
DCS/iG-D40/BOYD4-Q4-01-2024
E-mail: danila@data40.com
Phone: +44 7466371493
Address: 010000, Republic of Kazakhstan, Astana city, Yesil district, Dostyk street 20, office 1501
More researches at https://data40.com/buy-data/
All rights reserved 2024


